2021 Dairy outlook update: High feed costs still impact profitability

This is the final quarterly update to our 2021 Outlook for Canada’s dairy sector published in January. Last week, we updated our grains, oilseeds, and pulses outlook, and in the next two weeks, we’ll update the outlooks for cattle and hogs, and broilers.
Profitability projections have been holding steady since our August update. Farm milk revenues projections have slightly fallen for the P5 (Eastern provinces except for Newfoundland and Labrador) and marginally improved for the Western Milk Pool (WMP). Regarding costs, high world grain prices and access to feed in Western Canada contribute to higher production costs and are items on our watch.
The January and November gross revenues forecasts are less than 1% apart (Table 1). However, actual and updated projections of feed cost indices show large increases since our January forecasts.
Table 1: Estimates of average dairy revenues and feed cost indices
| January forecast for 2021 | Actual Q1-Q3 2021* | Forecast Q4 2021 | November forecast for 2021 | ||
|---|---|---|---|---|---|
| P5 | Gross revenues ($/hl) | 81.78 | 80.80 | 82.10 | 81.12 |
| Feed cost index | 100 | 106.3 | 109.5 | 107.1 | |
| WMP | Gross revenues ($/hl) | 82.69 | 82.76 | 84.66 | 83.23 |
| Feed cost index | 100 | 104.8 | 105.6 | 105.0 | |
* Data for September were not yet available and are forecasted.
Sources: FCC feed cost projections are based on Statistics Canada table 18-10-0266. Gross revenues are calculated using data from the Government of Alberta, the Dairy Farmers of Ontario, Statistics Canada and USDA. The calculations for gross revenues do not include the butterfat premium and penalties for over-quota production.
The demand for dairy products is not growing at the pace anticipated earlier this year because of the spread of the delta variant. Although production is not growing at the expected rate, it’s still a respectable rate. In the P5, between August 2020 and August 2021, butterfat production for fluid purposes grew 1.8%, and butterfat production for industrial purposes grew 3.3%. For the same period in the WMP, butterfat production for fluid purposes grew 7.7% and butterfat production for industrial purposes grew 2.7%.
However, when comparing August 2021 to August 2019, the numbers are disappointing. In P5, production for fluid purposes declined by 0.6%, but production for industrial purposes grew by 7.8%. In the WMP, over 24 months, production for fluid purposes declined by 2%, but production for industrial purposes grew 6.0%
Given the weaker than anticipated demand, the P5 cancelled 2 incentive days for October, following the cancellation of several incentive days in the previous months. There are currently no incentive days for the Fall in the WMP. The number of unfilled credit days, which represent unrealized production volumes, in the P5 is high, and that could cause disruptions if they come forward suddenly.
With vaccination rates increasing, consumers are returning to their pre-pandemic habits, but at a slower pace than expected. But the short-term outlook is positive. Recent increase in fluid milk, yogurt and cheese sales has supported farm prices and signal that demand is gearing toward normalcy. We forecast dairy cash receipts to increase by 4.4% in 2021.
The price of feed in Alberta is a source of concern. The drought in the West has pressured the market for animal feed in ways that our projections have difficulties capturing. This raises the possibility of underestimating the rise in feed costs in Western provinces in the table above. Data from the Alberta Ministry of Agriculture and Forestry show a remarkable increase in feed costs. In May 2021, the price of hay in Alberta bottomed at $131/ton but then surged to reach $256/ton in September (+95%). Similarly, the price for feed barley went from $6.00/bu in May to $6.95/bu in September (+16%).
To address the rise of production costs, the Canadian Dairy Commission announced in late October an increase in support prices that will result in a $6.31/hl increase in farm gate milk price. Pending approval by provincial authorities, the new support prices will become effective on February 1, 2022.
Cheese and curd imports on the rise
Strong energy prices and diverging signals regarding the strength of Canada and U.S. economies have kept the loonie flying high since the start of the fourth quarter. The Canada-U.S. exchange rate began the year at US$0.78, climbed up to US$0.83 in June and then dropped slightly below US$0.80 in Q3. We expect the currency pair to stay above US$0.80 in Q4 with a slight upward bias if energy prices rise.
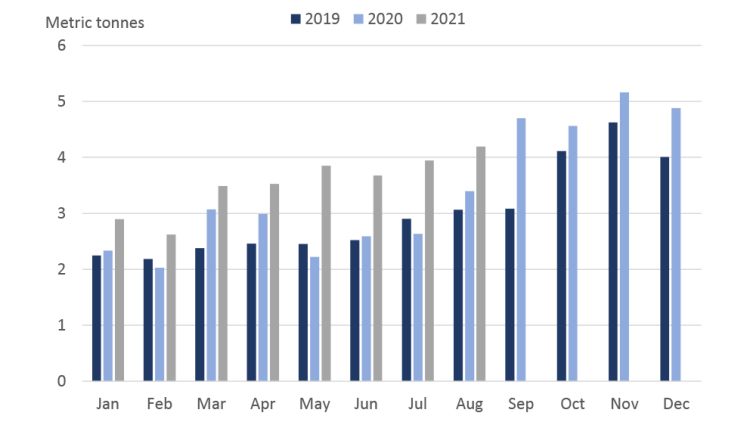
In the August update, we observed growth in imports of milk and cream not concentrated in the first five months of 2021. The strong import volumes weakened closer to their 2020 levels starting in June. Imports of cheese and curd have increased by 33% in the first 8 months of 2021 compared to the same period in 2020. The growth comes from a general increase in imports from Canada’s main suppliers.
Figure 1: Imports of cheese and curd growing in 2021

Source: Canadian International Merchandise Trade Database from Statistics Canada.
U.S. dairy prices
For Q3, the U.S. non-fat dry milk price stayed put from Q2 averaging US$1.27/lb. Lately, the U.S. non-fat dry milk jumped up to US$1.32/lb in September and to US$1.41/lb in October. Accordingly, the monthly minimum price in Canada for class 4a milk, which is based on the U.S. non-fat dry milk price, has increased by $2.66/kg in September, +18% from January.
In its latest supply and demand estimates, USDA kept its 2021 estimate for U.S. non-fat dry milk price unchanged since the Q2 update at US$1.25/lb. However, the USDA significantly raised its 2022 forecast for U.S. non-fat dry milk price from US$1.27/lb in September to US$1.38/lb in October. The basis for that update is lower expected production from smaller dairy cow numbers.
Reopening of food services
The complete reopening of food services is crucial to the full recovery of the demand for dairy products. That will take time as the pandemic took a severe toll on food services and sanitary measures are not all lifted. Compared to their pre-pandemic levels, Canada counts more than 3,000 fewer accommodation and foodservice businesses and counts about 170,000 fewer employees in food services. Customers must also re-adopt their pre-pandemic habits. Google mobility data show that visitors in retail and recreation places are still 2.4% below its early 2020 level.
Article by: Sébastien Pouliot, Principal Economist
