The one statistic you need to know this crop year

Over the next three weeks, we’ll cover economic fundamentals that can help you make sense of what’s happening in the markets.
We’ll dig into the stocks-to-use ratio, one of the best tools to gauge future price movements and previous trends. It’s simple, easy to use and informative – a clear advantage in forecasting future revenues and building sound marketing plans.
Fundamental analysis of commodity prices looks at the interactions among combinations of supply and demand factors. It is the heart and soul of economic analysis. The stocks-to-use ratio (SU) summarizes all those factors in one statistic - it’s quite powerful!
It assumes that a commodity price reflects its current and/or expected scarcity or lack of in the marketplace. When that commodity supply is tight relative to demand, its prices should edge higher.
Conversely, a relatively large supply – one that can exceed current and/or future demand – will lower prices.
We use it to understand previous market trends or form expectations of future inventories (supply) and use (demand).
Calculating a stocks-to-use ratio
A stocks-to-use ratio measures a commodity’s inventory volume at a point in time (e.g., ending stocks for a given Marketing Year (MY)), expressed as a share of the volume of that commodity’s total use in that same MY (what will be used domestically and exported).
How does it work?
Recent USDA projections for U.S. corn suggest the following:
| Corn ending stocks at 2017-18 MY-end | 2.18 billion bu. |
| Imports for the 2018-19 MY | 0.05 billion bu. |
| 2018 production* | 14 .04 billion bu. |
| Corn supply available in 2018-19 MY | 16.27 billion bu. |
| The USDA projected total corn use for 2018-19** | 14.59 billion bu. |
| Projected ending stocks at 2018-19 MY-end | 1.68 billion bu. |
| Corn ending stocks at 2018-19 MY-end | 1.68 billion bu. / 14.59 billion bu. = 11.5% |
* Growing conditions in the U.S. have indicated potential yields which, with estimated seeded acres, provides the expected 2018 production.
** Includes all anticipated uses of corn from ethanol production, exports, use as feed, domestic processing, etc.
Increasing corn’s total use in 2018-19 to 15.09 billion bushels in the example would result in much lower end-of-year stocks (1.2 billion bushels), and a ratio of 7.8% (1.18/15.09). With corn use this strong, we’d expect the price of corn to rise. Over the last 40 years, the lowest corn stocks-to-use ratio of 5% was recorded in 1995. It has never exceeded 62%, its highest value reached in 1985.

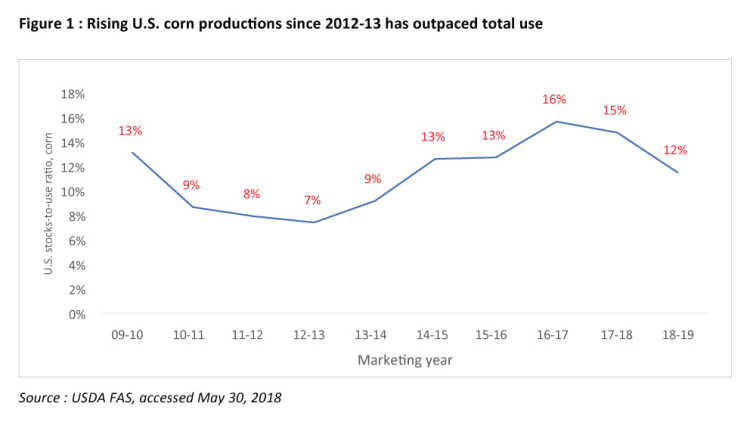
Growth in U.S. production of corn has greatly outpaced demand since the 2012-13 MY (Figure 1). The SU ratio more than doubled in the following 4-year period.
The small decline between 2016-17 and 2017-18 is projected to widen in the 2018-19 projection. This ratio alone doesn’t tell the whole story about the most recent global market conditions for U.S. corn – but it does a good job reflecting anticipated changes in U.S. corn prices.
Low stocks-to-use ratios mean higher prices
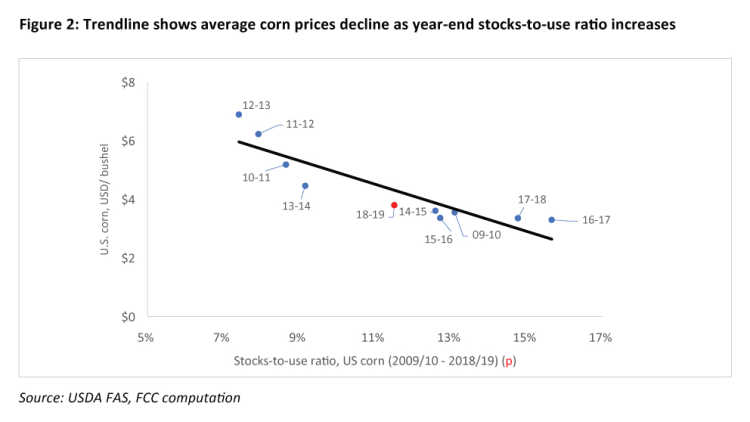
The trendline in Figure 2 shows that the SU ratio is clearly related to the average U.S. corn price. The downward slope from right to left indicates the two share a negative relationship: a higher SU ratio occurs when corn prices are lower (and vice versa).

The years with the highest SU ratios (2016-17 and 2017-18 as seen in Figure 1) are shown in Figure 2 to have been years with some of the lowest corn prices. Years with the lowest ratios in Figure 1 (e.g., 11-12 and 12-13) are found in Figure 2 to have been years with the highest corn prices (on the far left of Chart 2).
There’s a caveat however. While it’s a powerful tool, the SU ratio isn’t always accurate.
For example, it was a poor predictor of the average U.S. corn price in 2012-13 and 2013-14. The ratio in 2012-13 (7.4%) was the lowest recorded in the last 10 years. But the drought-reduced production in the 2012-13 MY guided prices higher as a signal of possible future shortages. Higher prices led buyers to find alternatives other than corn, slowing total use. That prevented the ratio from climbing further. An unusual factor (major drought) made the 12-13 average corn price harder to project.
How you can use the ratio to make better decisions
Because SU ratios are powerful, commodity markets react to their implications. Any revision in the 2018-19 ratio (up or down) will move futures prices. You can use it too – to project your revenues and build a marketing platform that reflects your operation’s needs, challenges, and opportunities.
The next USDA release is June 12th. We’ll be back next week with news of the updated SU ratio and explore the added benefit it brings to analysis of market volatility.
Executive Vice President, Strategy and Impact and Chief Economist
J.P. Gervais is Executive Vice President, Strategy and Impact and Chief Economist at FCC. His insights help guide FCC strategy, monitor risks and identify opportunities in the economic environment. In addition to acting as an FCC spokesperson on economic matters, J.P. provides commentary on the agriculture and food industry through videos and the FCC Economics blog.
Prior to joining FCC in 2010, J.P. was a professor of agricultural economics at North Carolina State University and Laval University. J.P. is a Fellow of the Canadian Agricultural Economics Society. He obtained his PhD in economics from Iowa State University in 1999.
