Debt service coverage ratio: Anchoring farm financial fitness

Farm debt outstanding climbed again in 2024, enough that it surpassed $166 billion.
We use a key measure of Canadian agriculture’s financial health, the debt service coverage ratio (DSCR), to understand how producers have been able to cover debt payments in periods when income fluctuates, or interest rates rise.
Debt service coverage ratio
The debt service coverage ratio measures an operation’s cash flow available to service debt.
DSCR = Income / Debt service
Income is defined as net cash income (farm revenues after taxes minus operating expenses before interest payments) plus other and off-farm income. “Debt service” includes all debt obligations in a year, including short-term debt and the current portion of long-term debt (loan principal due in the next twelve months or current portion of lease payments, for example) plus interest.
How it works
A DSCR of 1.5 indicates an operation has 1.5 times more cash available to pay current debt obligations than the total amount owing. A ratio below 1 indicates an inability to rely on net cash income and requires off-farm income to service debt.
If a DSCR is too low, a farm may find it hard to make payments on what is owed using only revenues. A very high DSC may not be optimal either. While it can reflect an operation that doesn’t need debt to generate revenue, it may also point to one that’s not exploiting market opportunities.
A note of caution
The DSCR can be calculated using different formulations of income and debt service. Compare different ratios only within each sector over time.
Understanding farm debt outstanding
Historically, Canadian farm debt grows between 5% and 7% each year. It’s now over the C$166 billion mark. But neither fact is cause for concern if farm income continues to gain enough to meet debt service payments, cover costs of production and, over time, grow equity. That’s still true even in periods when debt grows faster than income.
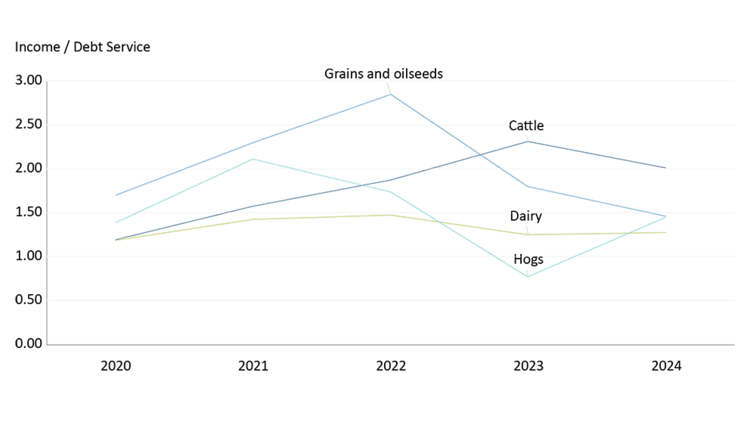
To understand the magnitude of farm debt outstanding, we need to look at income, and how trends in income will be able to match trends in debt obligations. Canadian 2024 farm cash receipts totalled C$97.9 billion. They grew 37% between 2020 and 2024, helping net cash income grow 25% in that same period. This helped to keep the average DSCR for dairy, cattle, and grains and oilseeds farms* in a healthy range between 2020 and 2024 (Figure 1). Grain and oilseed operations are highly dependent on crop size and prices, both of which were strong in 2022 leading to the high DSCR. While the ratio has retreated in recent years, it remains above 1. Hogs dipped below the healthy range in 2023 as operations faced slaughter capacity challenges in Eastern Canada but rebounded in 2024. Dairy experiences stability year-over-year, helping operations to utilize their cash for making investments while maintaining a healthy ratio. Farm cash receipts are expected up in 2025, but challenges related to interest costs are expected to persist, which may pressure DSCR for some operations.
Figure 1: Rising net income maintains healthy average DSC ratios across sectors

Source: FCC Portfolio data
What does the future hold?
Price volatility and higher borrowing costs can raise financial risk. But while rising rates and swinging incomes can challenge the ability to meet debt obligations, Canadian ag is, overall, in a good spot to weather any downturn that may occur.
As with each ratio we highlight throughout this series, the DSCR is only one view of the financial health of Canadian agriculture. Using different ratios together fills out the big picture. As well, using the average DSCR as we’ve done here doesn’t begin to tell the whole story, as it reflects both operations with recent production investments and lower DSCR scores, and more mature operations carrying lower debt levels (and higher DSCR scores). Work with your lender and accountant to determine the suggested ratios for your specific industry and be sure to understand them according to your own strategy and the risks facing your own operation.
*This analysis is based on data from FCC’s portfolio (2020 – 2024).
Are you comfortable using financial statements to better manage your operation? A good place to start is your accountant, an FCC Relationship Manager or the free online course series, Manage Your Farm Finances.
Article by: Amanda Norris, Senior Economist

Canadian producers put equity to good use. Here’s a look at how debt can leverage agricultural assets as you manage your farm financial fitness.
