2020 dairy outlook update: COVID-19 consumption shifts upends profitability

FCC Economics will update its projections about profitability across three Canadian agriculture sectors (red meat, dairy, and grains, oilseeds and pulse) throughout July. We’ll describe what has happened in 2020 to-date and what to monitor over the next six months.
Earlier this year, FCC Economics identified four economic trends and issues that were likely to affect profitability in the dairy sector in 2020:
Slow production growth
Expanded market access to foreign dairy products
Robust domestic demand for dairy products
Higher milk price and input costs
In this mid-year outlook, we review what has influenced profitability in dairy so far this year, we update our forecasts for 2020 and identify factors to monitor for the remainder of the year.
COVID-19 derailed revenue projections in the first half of the year
Dairy producers’ revenues were increasing according to expectations until mid-March, but COVID-19 altered that course. Consumption patterns shifted significantly with the adoption of confinement measures: notably, the closure of food services caused significant drops in the demand for cream and cheese. In response, the P5 and the Western Milk Pool (WMP) adopted measures to cut production. Year-over-year butterfat production in April dropped by 0.61 million kg (-2.58%) in the P5 and by 0.15 million kg (-1.9%) in the WMP.
Milk revenues were lower for the first six months of the year compared to our January 2020 forecasts (Table 1). Summer yields for butterfat and proteins are lower, keeping average revenues relatively low for the rest of 2020. We expect milk revenues to recover, starting in the fall. Comparing 2020 to 2019, we now project that gross revenues will decline by 1.3% in the P5 and stay stable in the WMP. Costs also declined as feed prices trended sideways, and interest rates and energy prices declined. Hence, dairy farms’ total costs for 2020 will be lower than those we forecasted in January, but they will drop proportionally less than revenues. As a result, average returns to dairy farms will be lower in 2020 than in 2019 (Table 1).
Table 1. Estimates of average dairy farm revenues and costs
| January 2020 forecast | Actual January - June* | Forecast July - December | Year total | ||
|---|---|---|---|---|---|
| P5 | Gross revenues ($/hl) | 80.80 | 79.08 | 77.52 | 78.30 |
| Total costs ($/hl) | 81.38 | 80.98 | 81.02 | 81.00 | |
| WMP | Gross revenues ($/hl) | 82.93 | 81.59 | 81.00 | 81.29 |
| Total costs ($/hl) | 76.52 | 76.13 | 76.13 | 76.13 | |
* Data for June is not yet available and is forecasted. Sources: Calculations by FCC based on cost of production estimates from the Canadian Dairy Commission and Government of Alberta and data from the Dairy Farmers of Ontario, Statistics Canada, and the USDA. The calculations for gross revenues do not include the butterfat premium and penalties for over-quota production.
Two assumptions are critical for our forecasts to hold: 1) the impact of COVID-19 on dairy consumption continues to subside; 2) the immediate implications of the Canada-U.S.-Mexico Trade Agreement (CUSMA) are small. Note also that our forecasts are on per hectoliter basis and do not fully capture the impact on profitability from cuts in production.
Trends to watch for the remainder of 2020
Consumer demand for dairy products
Reopening of food services and schools will be crucial for the demand for dairy products to return toward normalcy. Food services are large consumers of cream and cheese. The basket of dairy products consumed at-home differs from the one consumed away-from-home. Although the consumption of dairy products at home increased when confinement measures were implemented, it was not enough to pick up the slack for all dairy products.
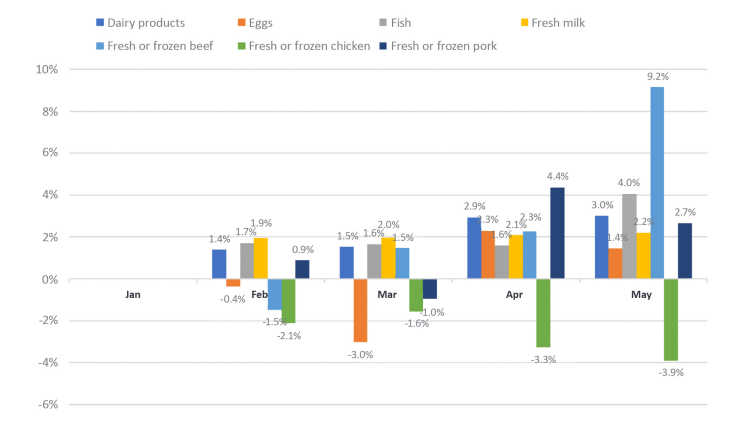
Dairy products were a competitive source of protein before the pandemic, but that position has changed since for specific products. Beef prices have increased the most: 9.2% since January. On the opposite end, chicken prices have declined by nearly 4%. Dairy products and fresh milk are about in the middle of the pack, staying competitive with fish and pork but losing a bit to eggs. We can expect inflation to subside for beef as production is ramping up while chicken prices could trend upward with cuts in production.
Figure 1: Inflation for selected protein products since January 2020

Source: Statistics Canada table 18-10-0004.
1. CUSMA
CUSMA launched July 1st. The main components of the agreement regarding dairy are as follows:
- Market access: Volumetric increases in import quotas for most dairy products are estimated to give U.S. dairy exporters access to 3.6% of the Canadian dairy market by year 6. A 1% annual increase will follow this in market access in the next 13 years. For dairy products other than cheese, July counts as year 1 of the agreement and year 2 begins on August 1.
- Canadian exports: Canada agreed to limit exports of skim milk powder and infant formula. By year 2, Canada will export 35,000 MT of skim milk and 40,000 MT of infant formula. Exports above these levels will be subject to an export charge of $0.54 per kg for skim milk powder and $4.25 per kg for infant formula. In 2019 (calendar year), Canada imported 10.9 MT of SMP (HS 0402.10), and milk protein concentrates (HS 0404.90) while exporting 52.8 MT of these two products to countries other than the United States.
- Pricing: Elimination of class 7 for processed milk ingredients - milk components from this category will instead be sold into class 4a. The price of skim milk solids cannot be lower than the US price for non-fat dry milk. A major change to the Canadian dairy system is the pooling of milk revenues at the national level. This pricing adjustment will be carried out gradually over three years.
2. U.S. dairy prices
The U.S. non-fat dry milk price influences a share of Canadian solids non-fat revenues. The COVID-19 pandemic caused dairy prices in the United States to drop. In June, US non-fat dry milk traded slightly above USD 1.00 per pound, up from the low in April of USD 0.85 per pound but down from the January price of USD 1.27 per pound. The June US price for non-fat dry milk amounts to about CAD 3.00 per kg. As a rough comparison, using class 4a price in June of CAD 1.80 per kg and a processor margin of CAD 0.95 per kg, we find a price for SMP of CAD 2.75 per kg. These values suggest that recent Canadian SMP prices are similar to those in the United States.
3. Global and Canadian economic recoveries
Economies will recover from the COVID-19 shock, but the pace is unknown. Dairy producers benefit from the current low interest rates, low energy prices and weaker Canadian dollar. Conversely, lower consumer income and economic struggles in food services mean weaker demand for dairy products. A strong economic recovery will be crucial for growth in the dairy industry.
Article by: Sébastien Pouliot, Principal Economist