Margin uncertainty impacting Canadian seeding decisions

Seeding is rapidly approaching in Canada, and the question of what producers will plant this year is more uncertain than usual due to current and potential future trade disruptions. Since our 2025 crop outlook in January, tariffs and trade issues have expanded, however the focus on cereals experiencing a price resurgence relative to oilseeds has been confirmed. This outlook provides information to make informed marketing decisions based on producer seeding decisions amid uncertainties.
Crop prices volatile to start 2025
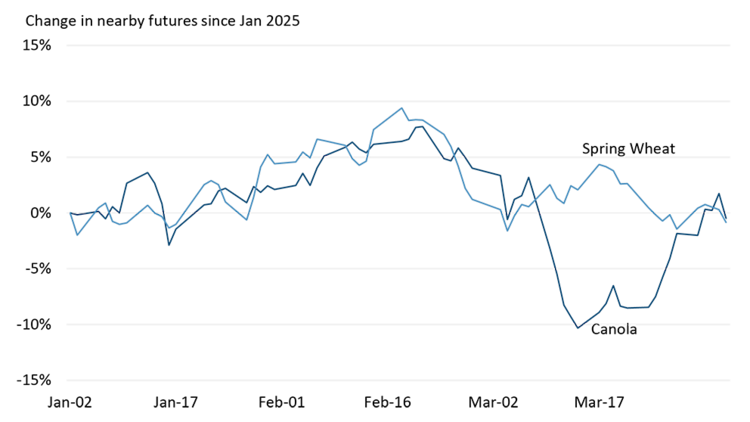
Despite all the U.S. tariff noise, canola and wheat prices fared pretty well to start 2025 relative to the beginning of the year. At one point in mid-February, canola and wheat futures were up 8% and 9%, respectively. They then fell, particularly canola prices after the Chinese tariff announcement in early March (Figure 1). However, canola futures have rebounded in the last three weeks, highlighting the ongoing volatility.
Figure 1: Canola futures prices were down 10% but have since recovered slightly

Sources: CME, FCC Economics
Soybean and corn prices experienced a similar phenomenon in the first three months of the year, rising in late January into February before falling back in March. During this period, a clearer picture of the size of the large South American soybean crop emerged, pressuring soybean prices.
Tight margins will get tighter with continued trade disruptions
Absent tariffs, profitability was already looking tight for the 2025-26 crop year; considering the impact of tariffs (or potential tariffs) makes that outlook even more challenging.
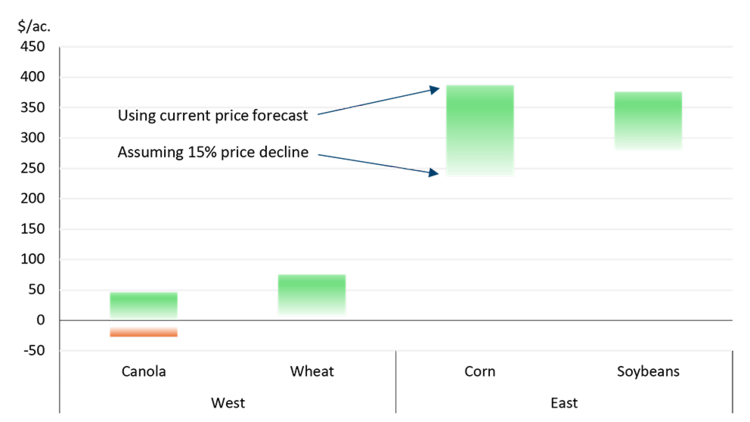
Our latest profitability estimates for wheat/canola in Western Canada showed average returns of $50-75/acre (excluding the cost of land). In the east, estimates were ~ $375/acre for both corn and soybeans, again excluding the cost of land. These numbers assume average yields at a regional level, so localized production shortfalls would trim these estimates. We also acknowledge the difficulty in forecasting prices in this environment and that there is considerable downside risk in these estimates. Given that, we illustrate what a 15% price decline would mean to these numbers. Such a decline would result in negative canola returns (-$25/acre) and breakeven wheat returns in the west. In the east, returns would fall to $240/acre for corn and $280/acre for soybeans (Figure 2).
Figure 2: Projected average returns over all costs (less land), 2025-26 crop year

Sources: Governments of Saskatchewan, Alberta, Manitoba, and Ontario; Statistics Canada; FCC Economics
Little change expected in major crop seeding intentions this spring
Producers in Eastern Canada have historically stuck tight to their soybean, corn, and winter wheat rotations. Over the last decade, corn and soybeans are the two crops least likely to see swings in seeded acres whereas the smaller crops (in terms of total acres seeded) see larger annual swings, relative to their averages (Table 1). In Ontario and Quebec, Statistics Canada estimates 3.9 and 3.1 million acres of soybeans and corn to be planted, respectively, in 2025. The U.S. is expected to plant nearly 5 million more corn acres this spring compared to last year as global stocks-to-use are tighter relative to soybeans.
Table 1: Quebec and Ontario seeded acres for major crops
Crops | Variability ranking (high to low)* | StatCan estimate 2025 |
|---|---|---|
Rye (all) | 1 | 210,200 |
Barley | 2 | 142,000 |
Oats | 3 | 177,200 |
Winter wheat | 4 | 1,268,500 |
Spring wheat | 5 | 190,100 |
Soybeans | 6 | 3,862,000 |
Corn | 7 | 3,141,600 |
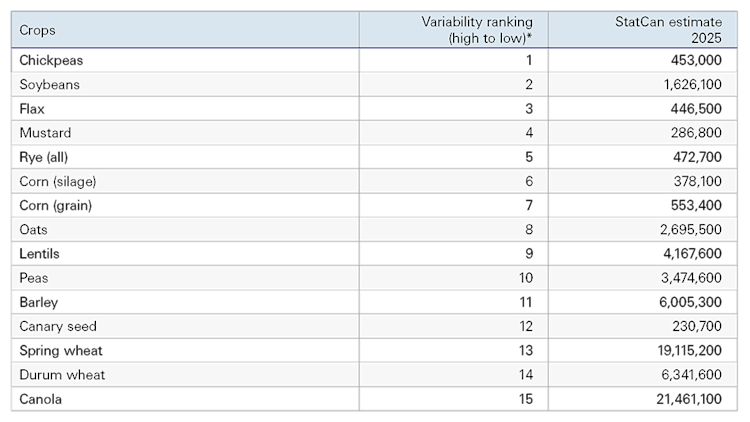
The story is similar in the west. Canola and wheat acres (both spring and durum) tend to deviate very little year-to-year (Table 2) relative to their respective averages. This was true even between 2019 and 2022 when China had import restrictions on canola seed from Canada. It is true that seeded canola acres were down in 2019 and 2020 but relative to record highs 2017 and 2018; indeed, seeded canola acres in 2020 were in line with 2015 and 2016 levels. Outside of agronomic considerations, this was likely a result of seed exports finding alternative markets and finding alternative routes to China. Exports to the EU were very strong in 2020 and 2021 (a result of very poor European rapeseed production in 2019 and 2020), partially offsetting the limited export opportunities to China. Statistics Canada estimates 21.5 million acres of canola to be seeded in 2025.
Table 2: Wheat and canola the least likely crops to see major changes in seeded acres historically

* A statistic for each crop was calculated and ranked accordingly from highest to lowest. The statistic considers changes in seeded acres year-over-year relative to the 10-year average. This allows for comparison between crops, irrespective of the total amount of seeded acres.
Sources: Statistics Canada, FCC Economics
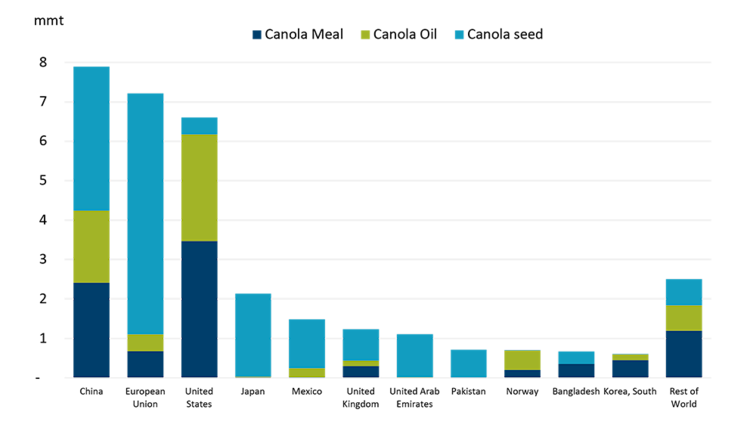
The situation this time around is different. The recently announced Chinese tariffs target oil and meal, not seed; and, with the expansion of domestic crush capacity, the industry looks different today than it did five years ago. There is a greater degree of market diversification for seed, less so for oil and meal. The U.S. and China dominate global meal and oil import markets, with over 65% of each product heading to one of those destinations (Figure 3).
Figure 3: Largest global importers of canola seed and products

Five-year average
Source: USDA PSD
European rapeseed production was down -14% in 2024 (and was the smallest crop since 2020) due to adverse weather. Correspondingly, between October 2024 and February 2025, over 700,000 mt of Canadian canola seed found its way to the EU, the highest export pace since 2020-21. This could be one reason why old crop prices have found support recently despite the Chinese tariffs and could provide support for the remainder of the current crop year. The level of EU production in 2025 could have a significant impact on 2025-26 canola prices and will be a watch item this summer.
We could see some ‘swing acres’ go into flax and lentils this year. Our profitability estimates for 2024-25 and 2025-26 show these two crops as having decent returns, and historically we’ve seen more variation in seeded acres with these crops, particularly flax which ranks third in our variability ranking (Table 2). We could also see more soybean acres in Manitoba given its historical year-to-year variation and the fact that potato acres could fall this year as buyers in that province have reportedly parred back purchases of potatoes this year.
Bottom line
Weather has been much less of discussion this winter, both because of the volatility of crop markets, but also because the improved drought maps show the best conditions coming out of winter since 2020. There’s still a long way to go before the crop is in the bin, though. Now more than ever, understanding individual farm production costs is important. The one thing we know about prices in 2025-26 is there will be volatility and, at times, opportunities to lock in returns. This is maybe truer in 2025-26 than in other years given prices are reflecting more geopolitical policy and less supply / demand fundamentals, and these policies can be implemented (or reversed) with the stroke of a pen.
Justin Shepherd, Senior Economist
Graeme Crosbie, Senior Economist
