2022 Dairy outlook update: Feed costs continue to rise

This is the first of three quarterly updates to our 2022 Outlook for Canada’s Dairy Sector published in January. Last week we updated our grains, oilseeds, and pulses outlook, and next week we’ll update the outlooks for cattle and hog.
Much has happened in the three months since we published our dairy outlook at the beginning of February. The war in Ukraine, which has impacted so many lives, rocked grains and oilseeds, fertilizer and energy markets. As announced by the Canadian Dairy Commission (CDC), a higher butter support price became effective on February 1st, increasing the farm gate price by 7-8% between January and February, depending on the region. The jump in the farm gate price percolated into the price of dairy products at retail. Nonetheless, consumption volumes remained strong even to the point that the P5 (Eastern provinces except for Newfoundland and Labrador) announced incentive days for May (1), June (1), August (1), September (2), October (2) and November (1) and a 2% quota increase effective April 1st. The story is, however, different for Western producers. The Western Milk Pool (WMP) is facing a milk surplus and, for that reason, announced a zero credit-use restriction policy which became effective on March 1.
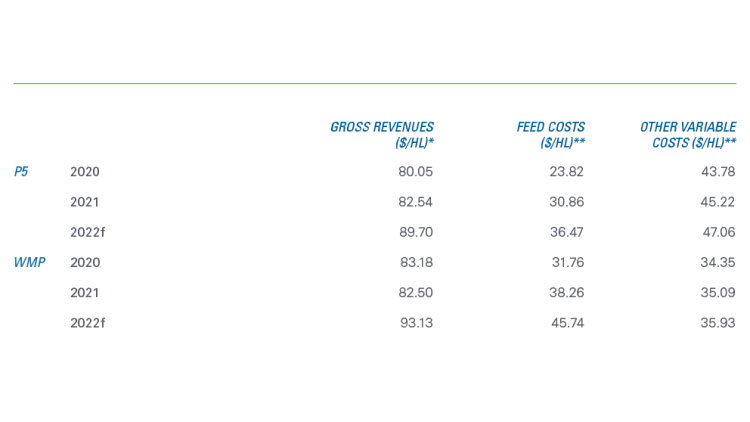
Table 1 summarizes revenues and costs data for 2020 and 2021 and our latest forecasts for 2022. From our January outlook, we revised slightly upward gross revenues to P5 farmers from the January outlook. Revisions were more significant for WMP farmers after farmgate prices significantly jumped in March. The increase comes from the end of milk disposal caused by floods and heavy snowfalls in British Columbia in the preceding months. We increased our feed costs forecasts for 2022 by about 10% following the rise in commodity prices caused by the war in Ukraine. Note that the feed cost estimates are opportunity costs, which means that farms able to grow their feed can do so at a lower cost. We made small upward adjustments to our forecasts for other variable costs.
Table 1: Estimates of dairy farm revenues and costs

Sources: Calculations by FCC based on cost of production estimates from the Canadian Dairy Commission and Government of Alberta and data from the Dairy Farmers of Ontario, Les Producteurs de lait du Quebec, Alberta Milk, Statistics Canada and USDA.
*Gross revenues are based on data reported by producer groups, which differ from Statistics Canada data used in calculating dairy receipts.
**The calculations use different definitions of cost categories for the P5, and WMP and therefore values are not directly comparable.
Our forecasts do not consider the CETA and CPTPP compensations from the federal government. The federal government is set to announce CUSMA compensations in the 2022 fall economic and fiscal update.
2022 trends to watch
1. Production costs
In our January outlook, we asked, “Have feed costs peaked?” We now know that the answer is no. As the grains, oilseeds and pulses outlook update shows, the war in Ukraine caused havoc in crop markets. To farms relying on purchased feeds, the war directly impacts their production costs. This is especially true for farms in the Prairies that must rely on imported feeds following the 2021 drought. Indeed, western Canada is expected to import 4.5 million tonnes of U.S. corn in 2021-22, compared to less than one million tonnes in a typical year.
The Canadian Drought Monitor shows that large areas of the Prairies are still in drought conditions. The pasture and hay crop quality will be key to keep production costs low for western producers. In eastern Canada, no region is currently in drought conditions, and the outlook is positive for another good hay harvest.
Energy prices have also climbed. The price of gasoline has increased by about 34% and the price of diesel by a spectacular 66%. Energy costs represent about 4% of dairy farms direct cash costs. It also indirectly impacts the cost of other inputs - hence their impact on profitability should not be understated.
2. Dairy product demand
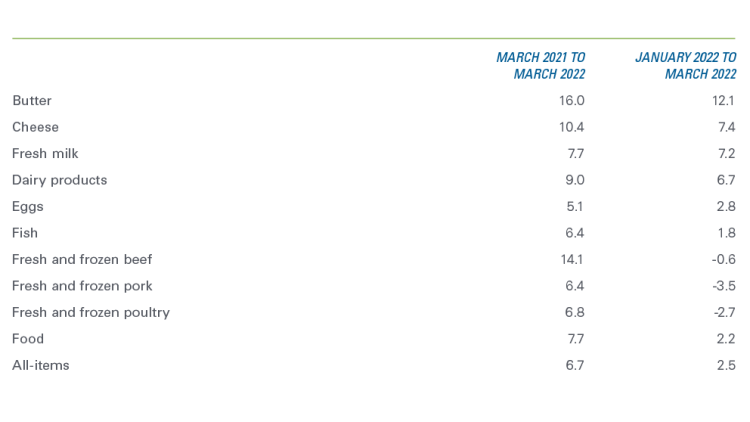
Retail prices for dairy products increased following the February 1 farmgate price increase. Most of the price increases happened in February and March. The largest was for butter, which recorded an increase of 12% between January and March 2022. The competitive position of dairy products has deteriorated in Q1 2022, with prices for other proteins increasing slightly or declining (Table 2).
Table 2: Inflation for selected products (%)

Source: Statistics Canada table 18-10-0004 and FCC economics.
Consumption of dairy stayed robust regardless of the higher prices. Nielsen data for retail sales show that dairy consumption volumes declined 5.4% in March 2022 compared to March 2021, with a 6.2% inflation rate. However, this ignores the impact of consumption shifting to food services with the removal of sanitary measures. For that reason, comparisons to other products are more telling of the strength of the demand for dairy products. For the same period, retail food sales declined 3.1% for a 5.4% inflation rate, while meat consumption declined 8.9% for a 9.7% inflation rate. Overall, this suggests that dairy products have had a similar importance in the customer’s baskets over the last year, even with prices jumping.
3. Dairy product imports
The government of Canada revised the allocation of licenses for importing dairy products in response to the findings of a CUSMA dispute settlement panel. However, the U.S. government is not satisfied with the revisions. The Canadian government recently closed consultations about how to implement the panel’s recommendation, and the dispute remains unresolved.
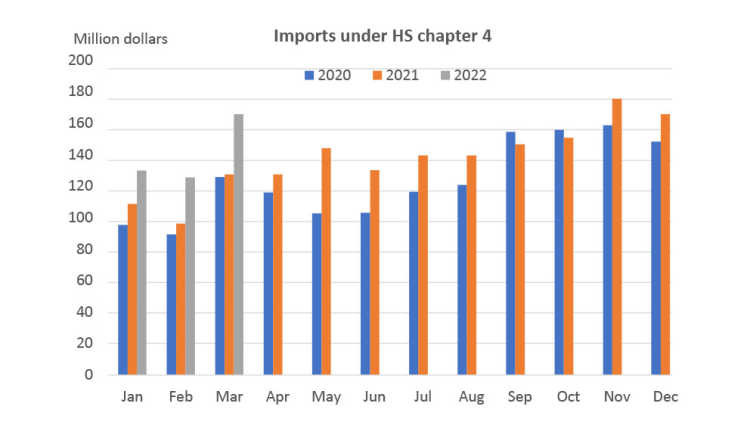
Canadian imports of dairy products have continued to grow. Figure 1 shows the monthly values for Canadian imports of dairy products. Since the beginning of 2022, the main source of growth has been butter imports due to low stocks and a higher support price.
Figure 1. Monthly value of total Canadian dairy imports

Source: Canada International Merchandise Trade online database.
4. Macroeconomic conditions
Inflation continues to be the top macroeconomic topic. The March inflation rate was 6.7%, the highest level since 1991. The Bank of Canada raised its policy rate by 0.75% this year, and other significant increases is a strong possibility. For more information on the macroeconomic environment, check out our Economic and Financial Market Update on June 2.
Check back on our blog for a regular update of this 2022 dairy outlook and outlooks on grain and oilseed, hog/cattle, broiler, and food processing sectors.
Article by: Sébastien Pouliot, Principal Economist
